Plotting
plot.fect.RdVisualizes estimation results of the matrix completion method.
Usage
# S3 method for fect
plot(x, type = NULL, loo = "FALSE",
            highlight = NULL, plot.ci = NULL, show.points = NULL,
            show.group = NULL, bound = NULL, vis = NULL,
            count = TRUE, proportion = 0.3, pre.periods = NULL,
            f.threshold = NULL, tost.threshold = NULL,
            effect.bound.ratio = FALSE,
            stats = NULL, stats.labs = NULL,
            main = NULL,
            xlim = NULL, ylim = NULL, xlab = NULL, ylab = NULL,
            gridOff = FALSE, legendOff = FALSE, legend.pos = NULL, legend.nrow = NULL,
            legend.labs = NULL, stats.pos = NULL, theme.bw = TRUE,
            nfactors = NULL, include.FE = TRUE,
            id = NULL,
            cex.main = NULL, cex.main.sub = NULL, cex.axis = NULL,
            cex.lab = NULL, cex.legend = NULL, cex.text = NULL,
            axis.adjust = FALSE, axis.lab = "both", axis.lab.gap = c(0, 0),
            start0 = FALSE,
            return.test = FALSE,
            balance = NULL,...)
Arguments
- x
a
fectobject.- type
a string specifying the type of the plot.
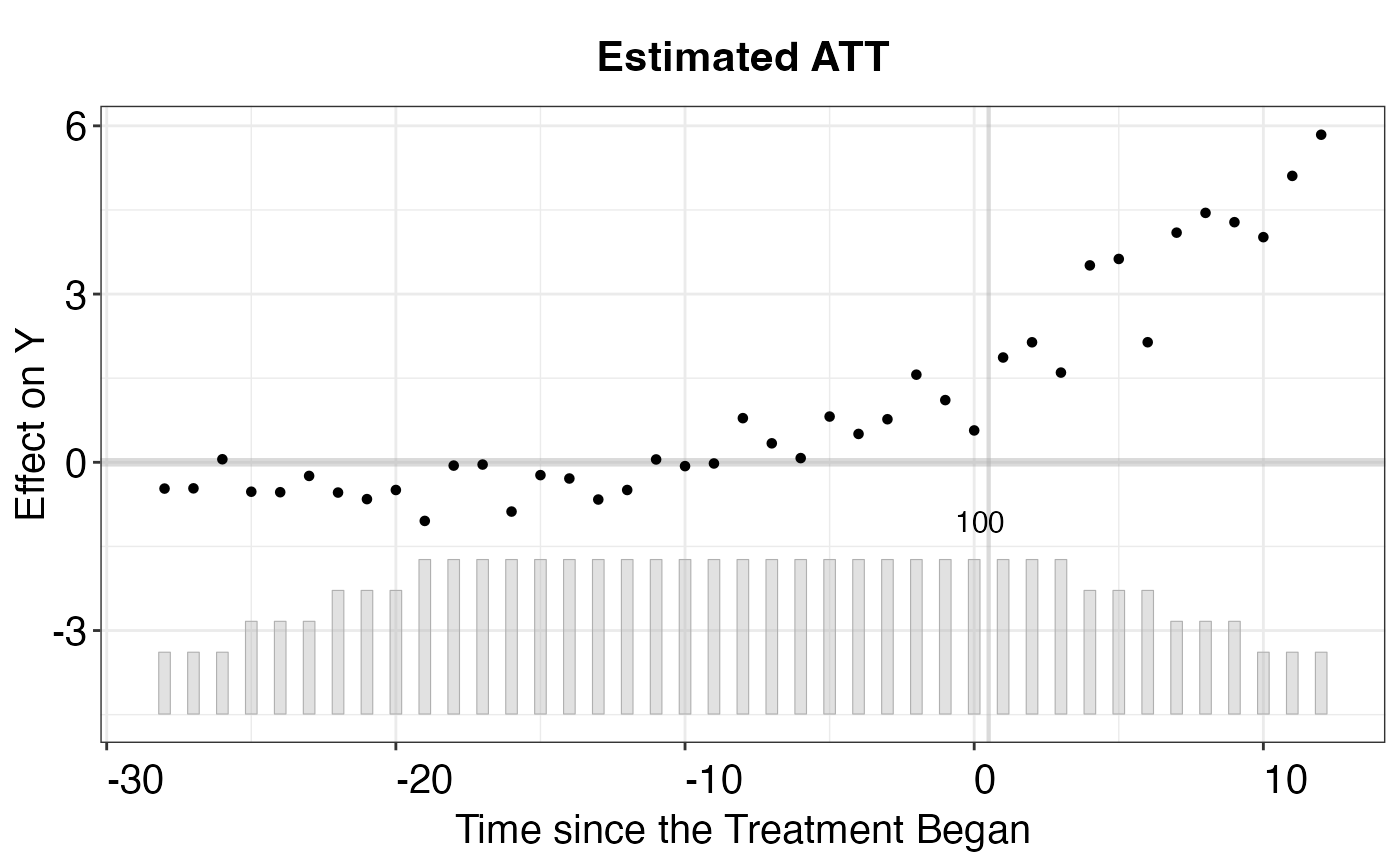
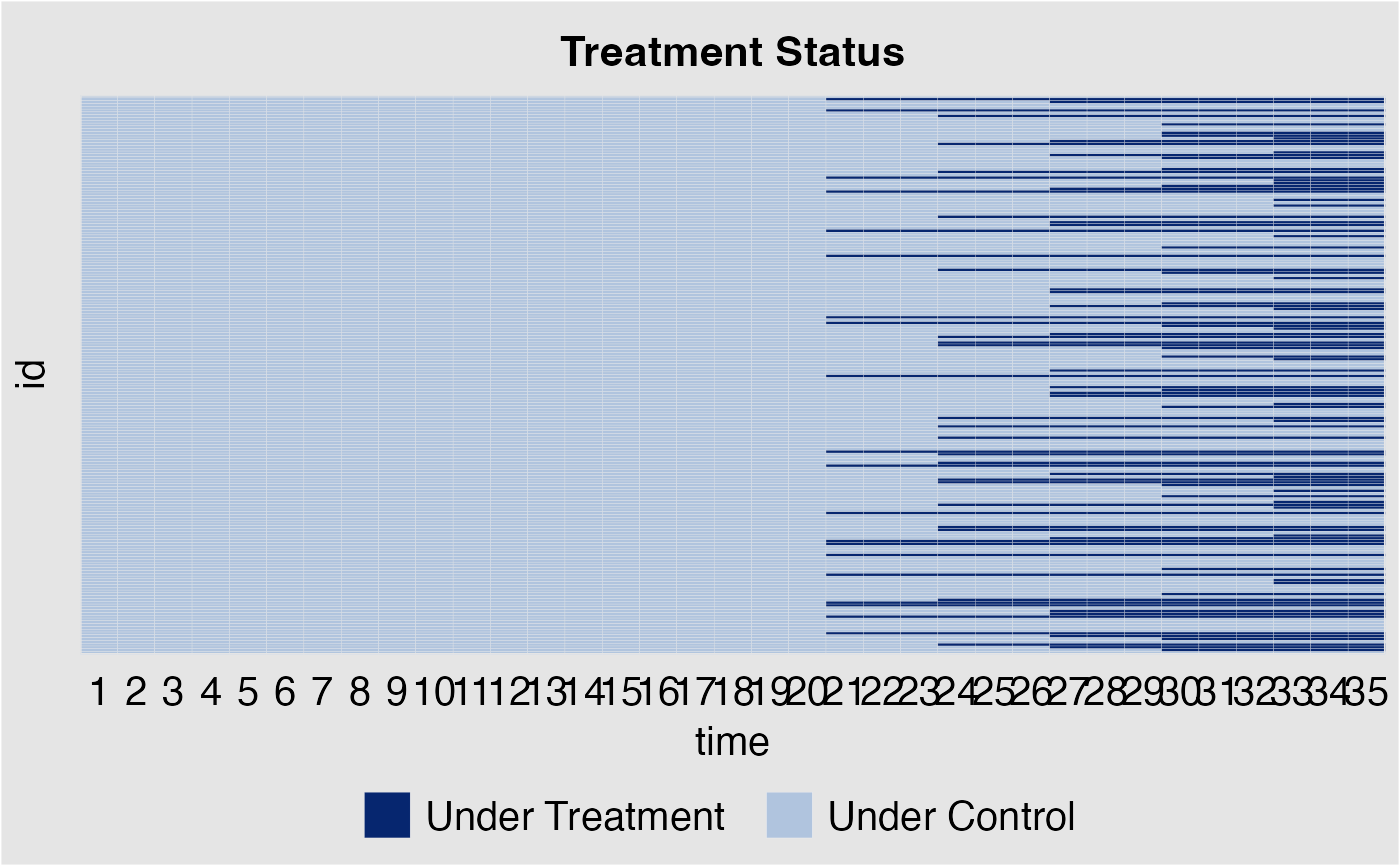
"gap"plots the estimated period-wise ATT (dynamic treatment effects),"equiv"shows the visualization of the equivalence test,"exit"plots the estimated period-wise switch-off effects,"status"shows the treatment status of all observations,"factors"plots the estimated factor and time fixed effects,"loadings"plots the estimated factor loadings and unit fixed effects,"calendar"plots the estimated treatment effects for each calendar period, and"box"visualizes the estimated individualistic treatment effects of observations.- loo
a logical flag indicating whether to use the leave-one-period-out pre-treatment effects for the visualization and tests.
- highlight
a logical flag indicating whether to highlight the periods for the carryover and placebo test.
- plot.ci
a string specifying the confidence interval. Choose from: "0.9", "0.95", or "none".
- show.points
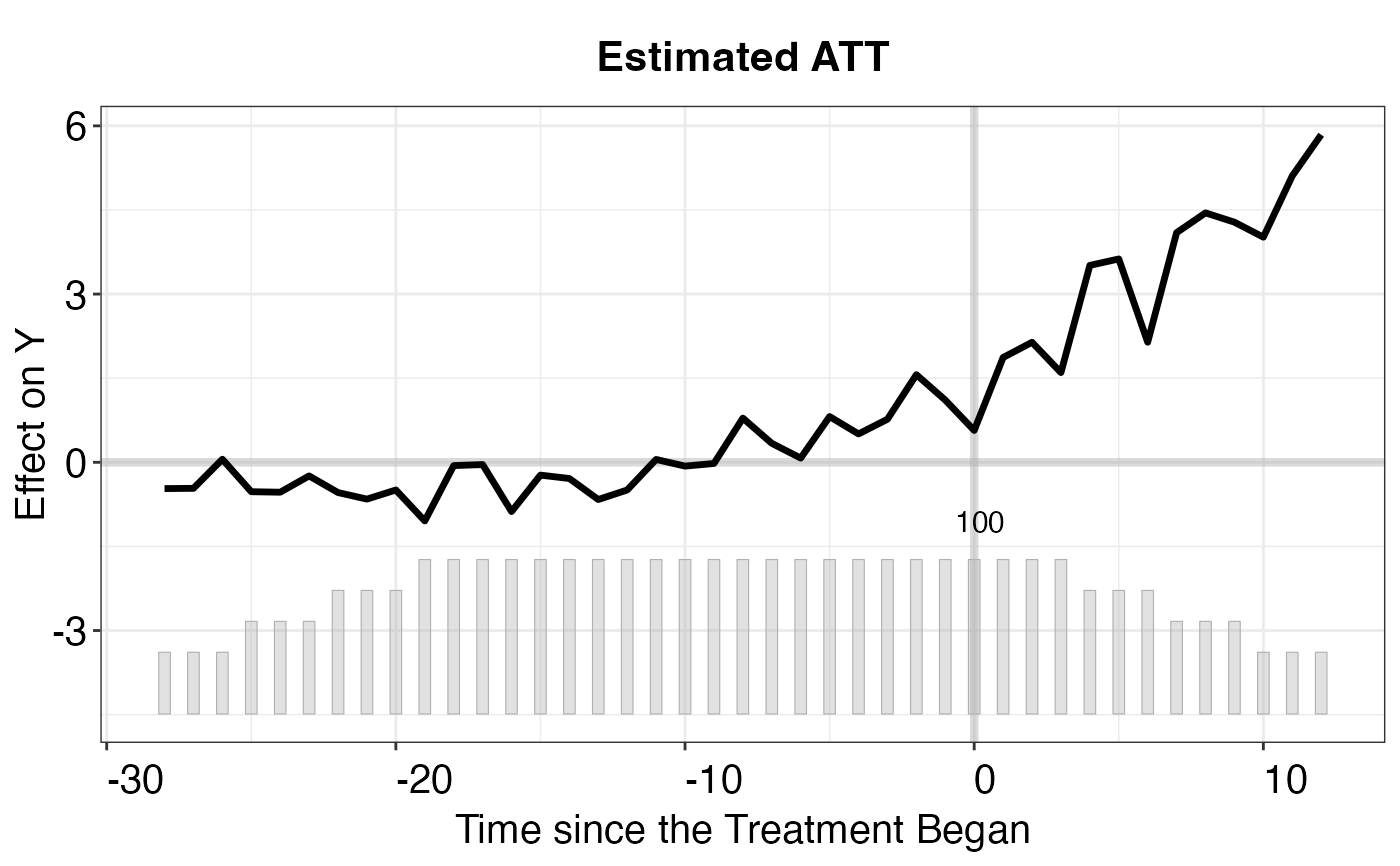
a logical flag indicating whether to represent treatment effects by points or point-ranges. Default to TRUE.
- show.group
a string indicating the group to be visualized.
- bound
a string that specifies the bounds to be plotted for equivalence test for pre-treatment fit checking. Choose from: "both", "equiv", "min" and "none".
- vis
A string specifying whether to plot the dots for placebo plots.
- count
a logical flag controlling whether to show the count of each term for gap plot.
- proportion
a positive value specifying periods at which observations equal to or greater than the proporation of the largest number of observations at a certain period. Default to 0.3.
- pre.periods
a vector specifying the range of pre-treatment period used for goodness-of-fit test. If left blank, all pre-treatment periods specified by
proportionwill be used. Ignore ifse = FALSE.- f.threshold
a numeric value specifying the threshold for the F-statistic in the equivalent test. Ignore if
se = FALSE. Deafult isf.threshold = 0.5.- tost.threshold
a numeric value specifying the threshold for the two-one-sided t-test. If
alpha=0.05, TOST checks whether the 90 The default value is 0.36 times the standard deviation of the outcome variable after two-way fixed effects are partialed out.- effect.bound.ratio
a logical value specifiying whether to annotate the ratio of estimated average treatment effects / minimun bound.
- stats
a string that specifices what statistics to be shown. For
"gap"plot, choose fromc("none", "F.p", "equiv.p", "F.equiv.p",), for"placebo"plot, choose fromc("none", "placebo.p", "equiv.placebo.p"), and for "carryover" plot, choose fromc("none", "carryover.p").- stats.labs
a string specifying the label for the statistics specified by
stats.- main
a string that controls the title of the plot. If not supplied, no title will be shown.
- xlim
a two-element numeric vector specifying the range of x-axis. When class of time varible is string, must specify not original value but a counting number e.g.
xlim=c(1,30).- ylim
a two-element numeric vector specifying the range of y-axis.
- xlab
a string indicating the label of the x-axis.
- ylab
a string indicating the label of the y-axis.
- gridOff
a logical flag indicating whether to remove the grid lines for the status plot.
- legendOff
a logical flag controlling whether to show the legend.
- legend.pos
a string specifying the position of legend. If left blank, legend will be setted at the bottom.
- legend.nrow
an integer speficying rows of legend.
- legend.labs
a string vector for user-defined legends.
- stats.pos
a numeric vector of length 2 specifying the postion for labels of test statistic value.
- theme.bw
a logical flag specifying whether to use the black and white theme.
- nfactors
a integer controlling the number of factors to be shown when
type='factors'.- include.FE
a loical flag indicating whether to keep the fixed effects when
type='factors'ortype='loadings'.- id
a string vector specifying a sub-group of units that are to be plotted for treatment status(
type = "status").- cex.main
a numeric value (pt) specifying the fontsize of the main title.
- cex.main.sub
a numeric value (pt) specifying the fontsize of the subtitles.
- cex.axis
a numeric value (pt) specifying the fontsize of the texts on the axes.
- cex.lab
a numeric value (pt) specifying the fontsize of the axis titles.
- cex.legend
a numeric value (pt) specifying the fontsize of the legend.
- cex.text
a numeric value (pt) specifying the fontsize of the annotations.
- axis.adjust
a logic flag indicating whether to adjust labels on x-axis. Useful when class of time variable is string and data magnitude is large.
- axis.lab
a string indicating whether labels on the x- and y-axis will be shown. There are four options:
"both"(default): labels on both axes will be shown;"unit": only labels on y-axis will be shown;"time": only labels on the x-axis will be shown; "none": no labels will be shown.- axis.lab.gap
a numeric vector setting the gaps between labels on the x- or y-axis for
"missing"plot. Default isaxis.lab.gap = c(0, 0), which means that all labels will be shown. Useful for datasets with large N or T.- start0
a logical flag indicating whether to index the start of the treatment as period 0 rather than period 1. Default to FALSE.
- return.test
a logical flag indicating whether to return the results of statistical tests.
- balance
a logical flag indicating whether to plot the dynamic treatment effects for the balance sample.
- ...
other argv.
Value
- p
a ggplot2 object saving the graph.
- test.out
a list storing the results of statistical tests if
return.test=TRUE.
References
Jushan Bai. 2009. "Panel Data Models with Interactive Fixed Effects." Econometrica.
Yiqing Xu. 2017. "Generalized Synthetic Control Method: Causal Inference with Interactive Fixed Effects Models." Political Analysis.
Athey, Susan, et al. 2021 "Matrix completion methods for causal panel data models." Journal of the American Statistical Association.
Licheng Liu, et al. 2022. "A Practical Guide to Counterfactual Estimators for Causal Inference with Time-Series Cross-Sectional Data." American Journal of Political Science.
For more details about the matrix completion method, see https://github.com/susanathey/MCPanel.
See also
fect and print.fect
Examples
library(fect)
data(fect)
out <- fect(Y ~ D + X1 + X2, data = simdata1,
            index = c("id","time"), force = "two-way",
            CV = TRUE, r = c(0, 5), se = 0, parallel = FALSE)
plot(out)
#> Uncertainty estimates not available.

plot(out,type='status')

plot(out,show.points = FALSE)
#> Uncertainty estimates not available.
